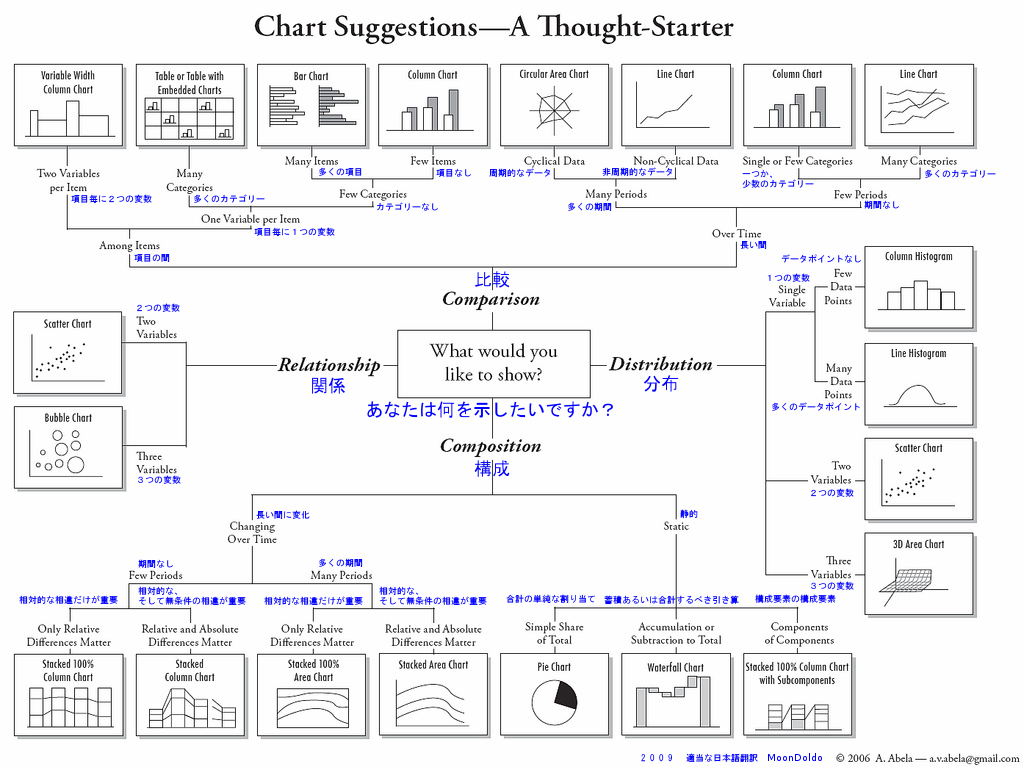
Chart Suggestions 適当な翻訳†
参考Webページ†
- How to Choose Chart Types on Flickr - Photo Sharing!
原版のデータです。
最初、この画像データは「creative commons」ライセンスで提供されていましたが、実際には本からの抜粋の様です(以下文書抜粋)
This graphic is an extract from Andrew Abela's book Advanced Presentations by Design.
Please credit the book and author when using this diagram.
- どういうときにどんなグラフを使えばいいかが一発でわかるチャート - IDEA_IDEA ~ 百式管理人のライフハックブログ ~
このデータが紹介されていたWebページで、私はこれでデータの存在を知りました。
適当な日本語翻訳のダウンロード†
単に翻訳ソフトで翻訳した物なので精度の良い日本語になっていません。
※「creative commons」の表記を削除しました。
GIMP2やPhotoShopで修正しやすいように、レイヤ分けされているpsd形式も入れてあります。
ちなみに私はGIMP2でデータを作成しました。
●How to Choose Chart Types | Flickr - Photo Sharing!
http://www.flickr.com/photos/amit-agarwal/3196386402/
●All sizes | How to Choose Chart Types | Flickr - Photo Sharing!
http://www.flickr.com/photos/amit-agarwal/3196386402/sizes/l/

■原版jpgファイルのクレジット
>3196386402_01d8d12017_b.jpg
(C) 2006 A.Abela

■ファイルのアップロードをした方のクレジット
http://www.flickr.com/photos/amit-agarwal/3196386402/sizes/l/
Uploaded on January 13, 2009 by labnol

■適当な日本語翻訳のクレジット
>3196386402_01d8d12017_b_jpn.psd
>3196386402_01d8d12017_b_jpn.txt
>3196386402_01d8d12017_b_jpn.jpg
2009 適当な日本語翻訳 MoonDoldo

●ファイルについて
修正を加えるなら、GIMP2かPhotoShopでpsdファイルを開くと、
文章ごとにレイヤ分けされているので便利です。

●翻訳したテキスト
Chart Suggestions - A Thought-Starter

What would you like to show?	あなたは何を示したいですか?

Comparison	比較
 Among Items	項目の間
  Two Variables per Item	項目毎に2つの変数
  One Variable per Item	項目毎に1つの変数
   Many Categories	多くのカテゴリー
   Few Categories	カテゴリーなし
    Many Items	多くの項目
    Few Items	項目なし
 Over Time	長い間
  Many Periods	多くの期間
   Cyclical Data	周期的なデータ
   Non-Cyclical Data	非周期的なデータ
  Few Periods	期間なし
   Single or Few Categories	一つか、あるいは少数のカテゴリー
   Many Categories	多くのカテゴリー

Relationship	関係
 Two Variables	2つの変数
 Three Variables	3つの変数

Distribution	分布
 Single Variable	1つの変数
  Few Data Points	データポイントなし
  Many Data Points	多くのデータポイント
 Two Variables	2つの変数
 Three Variables	3つの変数

Composition	構成
 Changing Over Time	長い間に変化
  Few Periods	期間なし
   Only Relative Differences Matter	相対的な相違だけが重要
   Relative and Absolute Differences Matter	相対的な、そして無条件の相違が重要
  Many Periods	多くの期間
   Only Relative Differences Matter	相対的な相違だけが重要
   Relative and Absolute Differences Matter	相対的な、そして無条件の相違が重要
 Static	静的
  Simple Share of Total	合計の単純な割り当て
  Accumulation or Subtraction to Total 蓄積あるいは合計するべき引き算
  Components of Components 構成要素の構成要素

![[heart]](image/face/heart.png)
